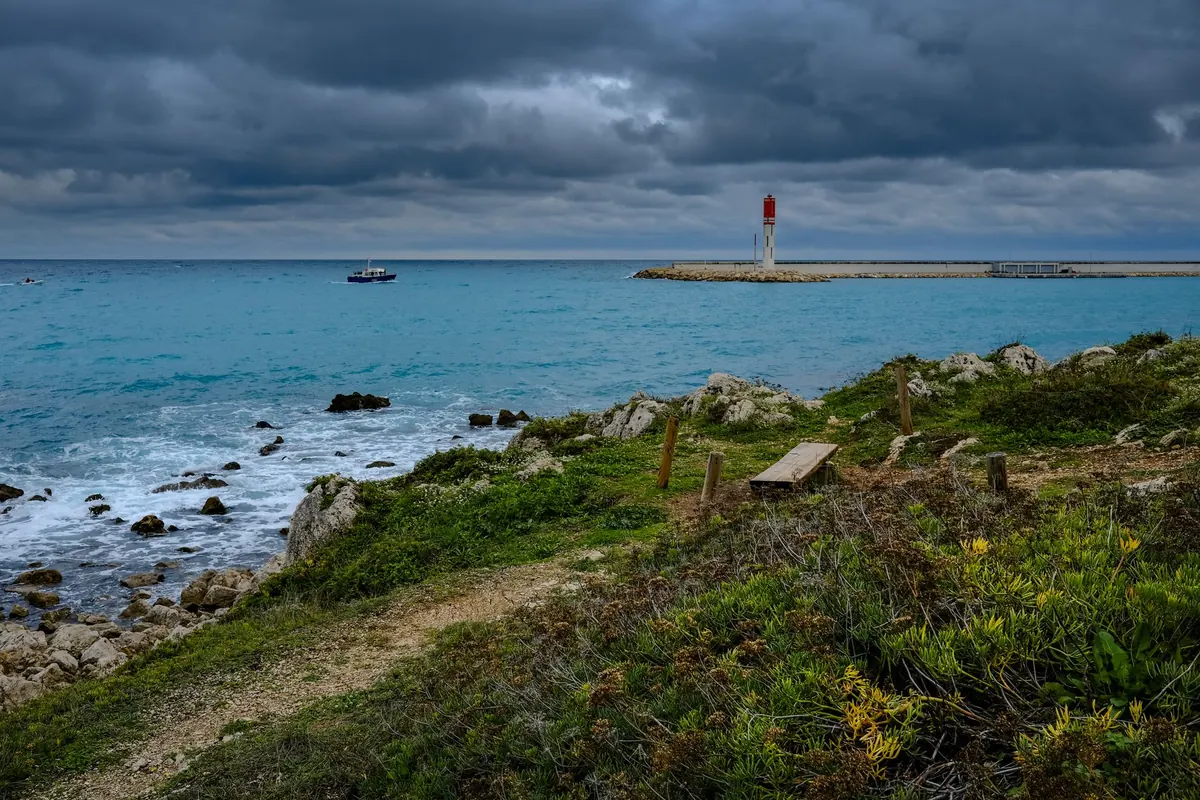
A nautical chart is a working document, drawn for people who are going somewhere on the water at night in bad weather. That is exactly why it is so useful from a clifftop. Every headland, every tower, every rock and every depth is plotted with a precision no walking guide bothers with, and every light carries a compact block of text describing precisely how it behaves. Learn to read those few lines and you can name a lighthouse two miles away, confirm it with a stopwatch, and stop squinting at silhouettes hoping for the best.
Choose the largest scale you can find
Charts come in sizes, and the difference matters enormously for shore work. An ocean passage chart might show a whole sea and mark only the great landfall lights. A coastal chart shows headlands and the principal lights. A harbour or approach chart, often around 1:10,000 to 1:25,000, shows individual buildings, jetties, slipways and small towers.
For lighthouse spotting, buy or print the largest-scale chart that covers your stretch of coast. You want the one that names the point you are standing on. If a single chart will not do it, a small-craft folio covering a bay or estuary usually will.
Then check the edition. Lights are discontinued, re-coloured, re-sited and re-timed, and a chart can be several years behind. Compare the chart against a current light list or official notice before you trust a detail, especially if you are travelling a long way for one particular tower.
Decoding the magenta block
On almost all charts, lights are printed in magenta: a small flare or star, sometimes with a dot marking the exact position, with a name and a line of code beside it. That code is the whole story. Take a typical entry such as Fl(2) 10s 25m 15M.
- Fl(2) — the character of the light. Two flashes in each group. Fl means a flash shorter than the darkness between; Oc (occulting) means the opposite, a light that is on longer than it is off; Iso is an even alternation of light and dark; Q and VQ mean rapid flashes; Mo means the light spells out letters in Morse.
- 10s — the period, the time in seconds for one complete cycle before the pattern repeats.
- 25m — the elevation of the lamp above mean high water. This is the height of the light itself, not the height of the tower, which is why a stubby tower on a high cliff can out-reach a tall one at sea level.
- 15M — nominal range in nautical miles in clear air. Treat it as a fair-weather figure.
- W, R, G, Y — white, red, green or yellow. A combination such as Fl(2)WRG means the light shows different colours in different sectors.
Coloured sectors are printed as arcs around the light, and they are your friends. A red sector usually warns of a danger on that bearing. If you are watching from the shore and the light turns red at a certain point of its rotation, you know exactly which stretch of water you are looking across.
Time it, and you have your proof
At dusk, half a dozen lights along one coast can look identical: a white flash every few seconds. Timing settles it. Start a stopwatch or count seconds on your phone at the first flash, and measure the interval until the whole pattern repeats. Two flashes, then a pause, repeating every ten seconds, is a fingerprint. Three flashes every fifteen seconds is a different lighthouse altogether.
Do this twice, from the same spot, and you will rarely be wrong. If the pattern does not match the chart, suspect a change to the light before you suspect your own eyes.
Use the landmarks the chart gives you
Charts are generous with landmark detail because mariners need it: church spires and towers, chimneys, radio masts, monuments, windmills, and annotations describing something as conspicuous. Combine those with the shape of the coastline and you can place a light precisely in the landscape.
The method is simple. Choose a distinctive feature near the light — a pointed headland, a pier head, a gap between two hills — and read its relationship on the chart. The tower stands on the outer point, a little north of the bay, with a steep cliff line running behind it. Then look up and match. Two lights close together that look almost the same from the beach will separate cleanly once you check which one sits inside the harbour wall.
Also look for leading lights: pairs of lights arranged so that when one appears directly above the other from the water, a vessel is on a safe line. From the shore these are a gift, because the transit line is often drawn on the chart with a bearing, and you can see from your viewpoint when the two lamps line up — a reliable confirmation that you have identified both correctly.
Work out where you are standing
You cannot use a chart from the shore until you have marked your own position on it. Pick something unmistakable: a named car park, a harbour wall, a headland with a trig point. Then transfer your viewpoint onto the chart.
If you have a compass, take a bearing to the tower and to one other charted object, correct for the difference between magnetic and true north using the compass rose printed on the chart, and draw the two lines. Where they cross is roughly where you stand. Without a compass, use relative bearings instead: the tower is a hand's width to the left of the church spire, and both sit above the eastern arm of the bay. That is usually enough.
Depths help more than you might expect. A line of soundings climbing steeply from twenty metres to two tells you the seabed falls away sharply and the cliff edge is close; a long shallow shelf means a wide beach or mudflat. The chart's picture of the water is also a picture of the land behind it.
Respect the limits of distance and weather
Nominal range assumes clear air. Haze, spray, low cloud and summer heat shimmer all cut it down, and a light that should be visible can vanish for an evening. Height helps: a rough rule of thumb is that the distance to the horizon in nautical miles is about 1.2 times the square root of your eye height in metres, so climbing a hundred metres up a cliff path genuinely buys you extra miles. A light's own elevation adds to that in the same way.
In daylight, forget the lamp and read the structure. Colour schemes, bands, height, the shape of the lantern room and the presence or absence of a keeper's cottage are all charted or listed, and they are what you will be matching against a silhouette.
A field routine that works
- Pick your stretch of coast and get the largest-scale chart that covers it.
- Check the edition and cross-check the lights against a current light list.
- Mark every light on the chart, and copy its full code into a notebook, one line each.
- Mark your viewpoints, then note what lies between you and each light — a headland that blocks, a bay that opens.
- On site, identify the structure first, then time the flash pattern to confirm it.
- Write down date, time, visibility and what you saw. After a season you will know which lights show from which car park, and which need a walk.
Keep the chart in a plastic sleeve, a pencil in your pocket and a stopwatch on your wrist. That small kit turns a coast of anonymous white flashes into a named, charted, quietly satisfying list.
Photo: Darkmoon_Art / Pixabay